GLP-1 Medication and Nutrition: Research Data and Clinical Statistics
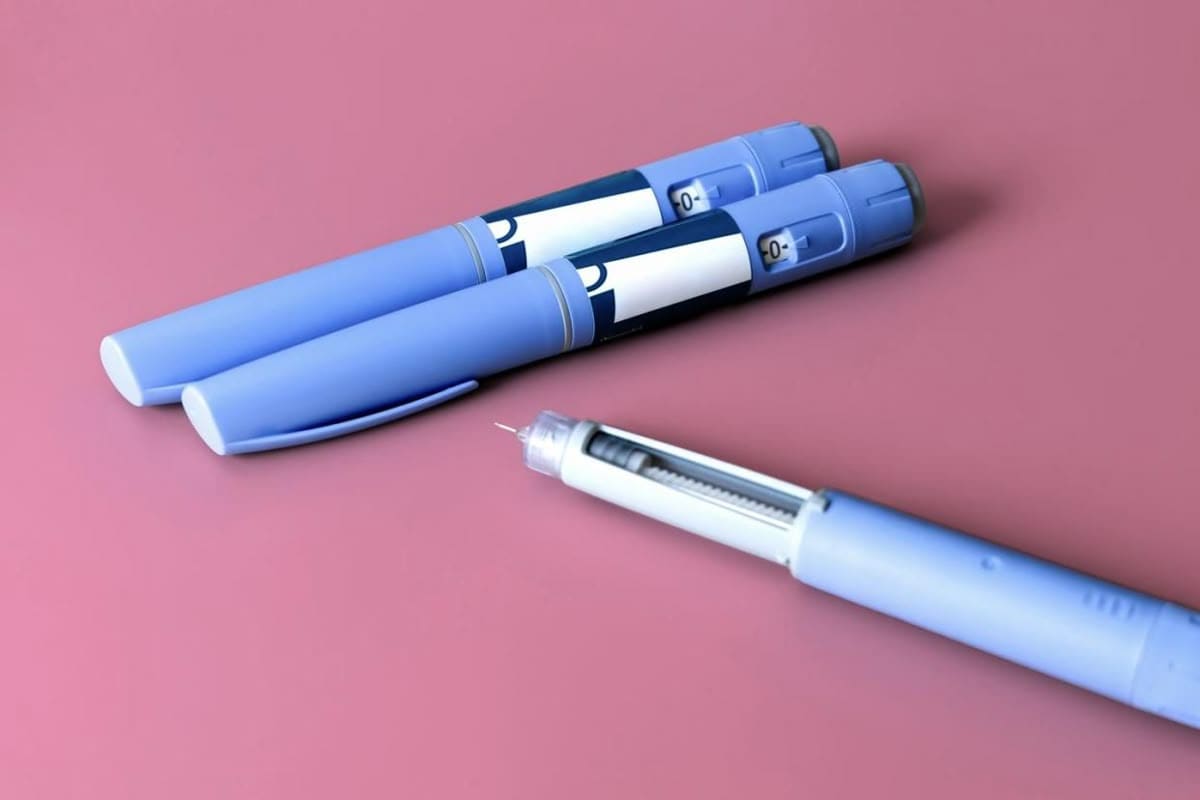
GLP-1 receptor agonists are among the fastest-growing medication categories. This data page compiles the clinical research on their nutritional implications — muscle loss rates, protein requirements, food interactions — for journalists, clinicians, and health writers.
0125 to 40% of weight lost on GLP-1 medications is lean mass (muscle) without dietary protein strategy
02STEP 1 trial: semaglutide produced 14.9% average body weight loss over 68 weeks
03Nausea affects 44% of semaglutide users (vs 16% placebo) — primarily during dose escalation
04Whey protein increases GLP-1 by 25 to 50% above baseline — strongest food-based GLP-1 trigger
05Tirzepatide produces ~20 to 22% body weight loss — higher than semaglutide — with similar lean mass considerations
GLP-1 Medication Clinical Trial Key Outcomes
Key clinical trial data for GLP-1 receptor agonists — weight loss and body composition
Medication
Trial
Average body weight reduction
Duration
Lean mass loss estimate
Semaglutide 2.4 mg (Wegovy)
STEP 1
14.9% of body weight
68 weeks
25 to 40% of weight lost from lean mass (without protein strategy)
Semaglutide 2.4 mg (Wegovy)
STEP 3 (intensive behavioral)
16.0% of body weight
68 weeks
Slightly lower lean mass loss with behavioral counseling
Tirzepatide 15 mg (Zepbound)
SURMOUNT-1
20.9% of body weight
72 weeks
Lean mass proportion similar to semaglutide without dietary guidance
Liraglutide 3.0 mg (Saxenda)
SCALE trial
8.0% of body weight
56 weeks
Similar lean mass loss concern at lower total weight loss
Semaglutide (Ozempic 1 mg, type 2 diabetes)
SUSTAIN 6
4.5 kg average loss
104 weeks
Cardiovascular primary endpoint trial; weight was secondary
Muscle Loss on GLP-1: The Data
The proportion of weight loss attributable to lean mass (muscle, bone, water) versus fat mass is a critical quality measure of weight loss interventions. For context: a diet-induced caloric deficit without exercise typically produces 75 to 80 percent fat loss and 20 to 25 percent lean mass loss. GLP-1 medications without specific protein and exercise guidance produce a higher lean mass proportion.
Lean mass vs fat mass loss on GLP-1 medications compared to other weight loss methods
Weight loss method
Approximate % from fat
Approximate % from lean mass
Notes
GLP-1 medication (no protein strategy, no exercise)
60 to 75%
25 to 40%
Wide variation across trials; higher lean loss than diet alone in some analyses
GLP-1 medication + high protein (1.4 g/kg+)
80 to 90%
10 to 20%
Significant improvement — protein preserves lean mass during restriction
GLP-1 medication + protein + resistance exercise
85 to 92%
8 to 15%
Best body composition outcomes; approaches caloric restriction gold standard
Moderate caloric restriction, no GLP-1
75 to 80%
20 to 25%
Standard diet reference point
Caloric restriction + resistance exercise
85 to 90%
10 to 15%
Gold standard comparison
Very low calorie diet (below 800 kcal/day)
50 to 65%
35 to 50%
High lean mass loss — shows risk of extreme restriction
Hydration; very small meals; ginger tea; rest after eating
Diarrhea
29.7%
16.0%
Soluble fiber (not insoluble); hydration; BRAT diet principles acutely
Constipation
24.2%
11.0%
Adequate fiber (25 g+); hydration; magnesium citrate if needed
Abdominal pain
22.6%
12.7%
Meal size reduction; slow eating
Discontinuation due to GI effects
4.5%
0.8%
Dose escalation pace adjustment helps most people
Gastroparesis concern (slowed stomach emptying)
Case reports — mechanism expected
N/A
Avoid large meals; chew well; avoid lying down after eating
Food Effects on Endogenous GLP-1 Secretion
Dietary triggers of natural GLP-1 release — research data on GLP-1 response
Food / nutrient
Effect on GLP-1
Evidence strength
Mechanism
Whey protein
25 to 50% increase above baseline (acute)
Strong — multiple RCTs
Rapid amino acid stimulation of L-cells; leucine particularly potent
Fermentable fiber (inulin, beta-glucan)
Sustained 2 to 4 hour elevation
Strong — multiple RCTs
SCFA production (butyrate, propionate) from bacterial fermentation → L-cell stimulation
Oleic acid (olive oil, avocado)
Moderate acute GLP-1 increase
Moderate — RCTs
Direct oleic acid stimulation of intestinal L-cells
Fermented foods (yogurt, kefir)
Gradual microbiome-mediated increase
Moderate — observational + mechanism
Improved gut bacteria → better SCFA production → enhanced GLP-1 signaling
Coffee (caffeinated)
Small, inconsistent GLP-1 effect
Weak — mixed evidence
Possible AMPK activation; not a primary GLP-1 strategy
Ultra-processed foods
Lower GLP-1 response vs whole food equivalents
Moderate — observational
Low fiber, designed to bypass satiety; reduced L-cell stimulation
High sugar diet (chronic)
Reduced GLP-1 receptor sensitivity over time
Moderate — mechanistic evidence
Chronic hyperglycemia may downregulate GLP-1 signaling
Physical activity
Acute GLP-1 increase post-exercise
Moderate — RCTs
Exercise increases GLP-1 secretion independently of food intake
GLP-1 Medication Usage and Market Data
GLP-1 medication market and usage statistics
Metric
Data
Source / Notes
Estimated U.S. GLP-1 users (2024)
~12 to 15 million prescriptions annually
Novo Nordisk and Eli Lilly earnings reports; pharmacy data
Estimated global market (2024)
$44 to 50 billion USD
Pharmaceutical market analysis reports
Projected global market (2030)
$130 to 150 billion USD
Goldman Sachs / Morgan Stanley pharmaceutical projections
Adherence at 12 months (real-world)
40 to 55% of users still on medication
Insurance claims and pharmacy data; lower than trial adherence
Average weight regain after stopping
~60 to 70% of lost weight within 1 to 2 years
STEP 4 extension trial data
Obesity prevalence (U.S. adults)
42% (NHANES 2017 to 2020)
CDC / NHANES national survey
Patients eligible for GLP-1 by BMI criteria (U.S.)
Estimated 72 million adults by current criteria
Based on BMI ≥30 or BMI ≥27 with weight-related comorbidity
Real stories, coming soon
Real people, real results
We're putting together real stories from people who use ZavoFit's guidance in everyday life. Coming soon.
Questions, answered.
How much muscle is lost on GLP-1 medications like semaglutide?
In the STEP clinical trials of semaglutide (Wegovy), participants lost an average of 14.9 percent of body weight. Of this weight loss, approximately 25 to 40 percent was lean mass (muscle) rather than fat mass — particularly in participants without specific protein guidance or resistance exercise. With intentional protein intake (1.4 to 1.6 g/kg/day) and resistance exercise, this ratio shifts significantly toward fat loss.
Do foods actually affect GLP-1 hormone levels?
Yes, measurably. Whey protein produces the strongest acute GLP-1 response of common foods — increasing circulating GLP-1 by 25 to 50% above baseline in multiple controlled studies. Fermentable fiber produces a sustained (2 to 4 hour) GLP-1 response via the short-chain fatty acid pathway. Oleic acid (in olive oil and avocado) directly stimulates intestinal L-cells to release GLP-1.
How does semaglutide compare to tirzepatide for weight and muscle outcomes?
Tirzepatide (Mounjaro/Zepbound) targets both GLP-1 and GIP receptors, producing greater average weight loss (approximately 20 to 22% of body weight vs 14.9% for semaglutide in trials). The lean mass loss proportion appears similar across both medications without dietary intervention. Both require the same protein and exercise strategy to protect muscle composition.
What protein intake does research support for people on GLP-1 medications?
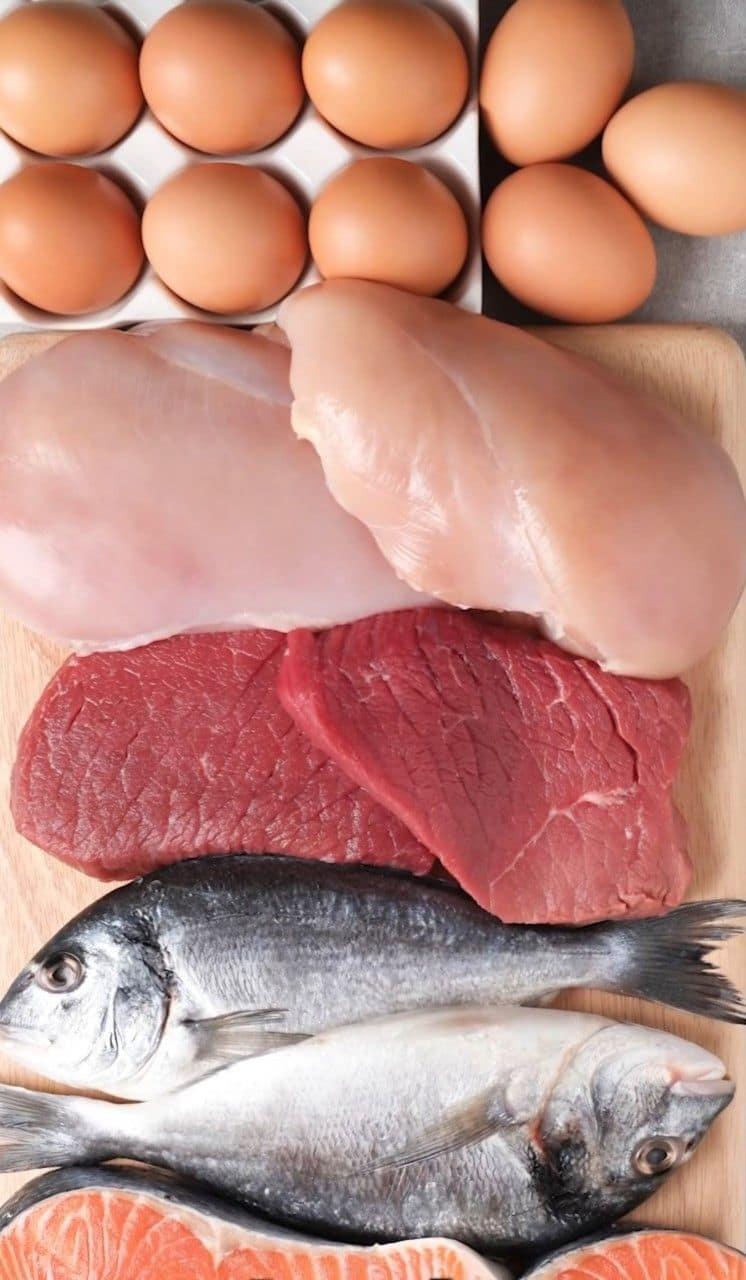
The STEP trials did not provide specific protein guidance. Expert analyses and subsequent clinical practice recommendations suggest 1.4 to 1.6 g/kg of body weight per day — higher than the standard RDA of 0.8 g/kg — because GLP-1-induced caloric restriction without protein compensation leads to disproportionate lean mass loss.
How common are nausea side effects with GLP-1 medications?
In the STEP 1 trial, nausea was reported by 44 percent of semaglutide participants vs 16 percent in the placebo group. Vomiting occurred in 25 percent vs 6 percent. Most nausea occurred in the first 4 to 8 weeks and during dose escalation. Dietary strategies (smaller meals, avoiding fatty/greasy foods, protein-first eating order) significantly reduce nausea severity.
Iron deficiency is the most prevalent nutritional deficiency worldwide. This data page compiles the key statistics, demographic breakdowns, and research findings that journalists and health writers cite most frequently.
This data page compiles the key research findings on protein needs after 50 — sarcopenia prevalence, anabolic resistance evidence, per-meal leucine thresholds, and the gap between the RDA and what research actually supports — for journalists, clinicians, and health writers.
Vitamin D deficiency is the most common micronutrient deficiency in adults over 50 — and one of the most consequential. Bone loss, muscle weakness, immune decline, and cognitive changes are all linked to levels that look "borderline" on a standard lab report.